
Your Mac’s activity. Finally explained.
See what’s using your Mac, understand what’s normal, and know when your workload needs more room.
$4.99 once, or try it free for 7 days. Apple silicon, macOS 26 or later.
- Development
- Everyday
- Video
What SystemStory shows
The numbers, and what’s behind them.
RAM, CPU, GPU and cooling from the menu bar - with the programs behind them, and history when you need it.
Grouped RAM
Hundreds of processes become a few programs.
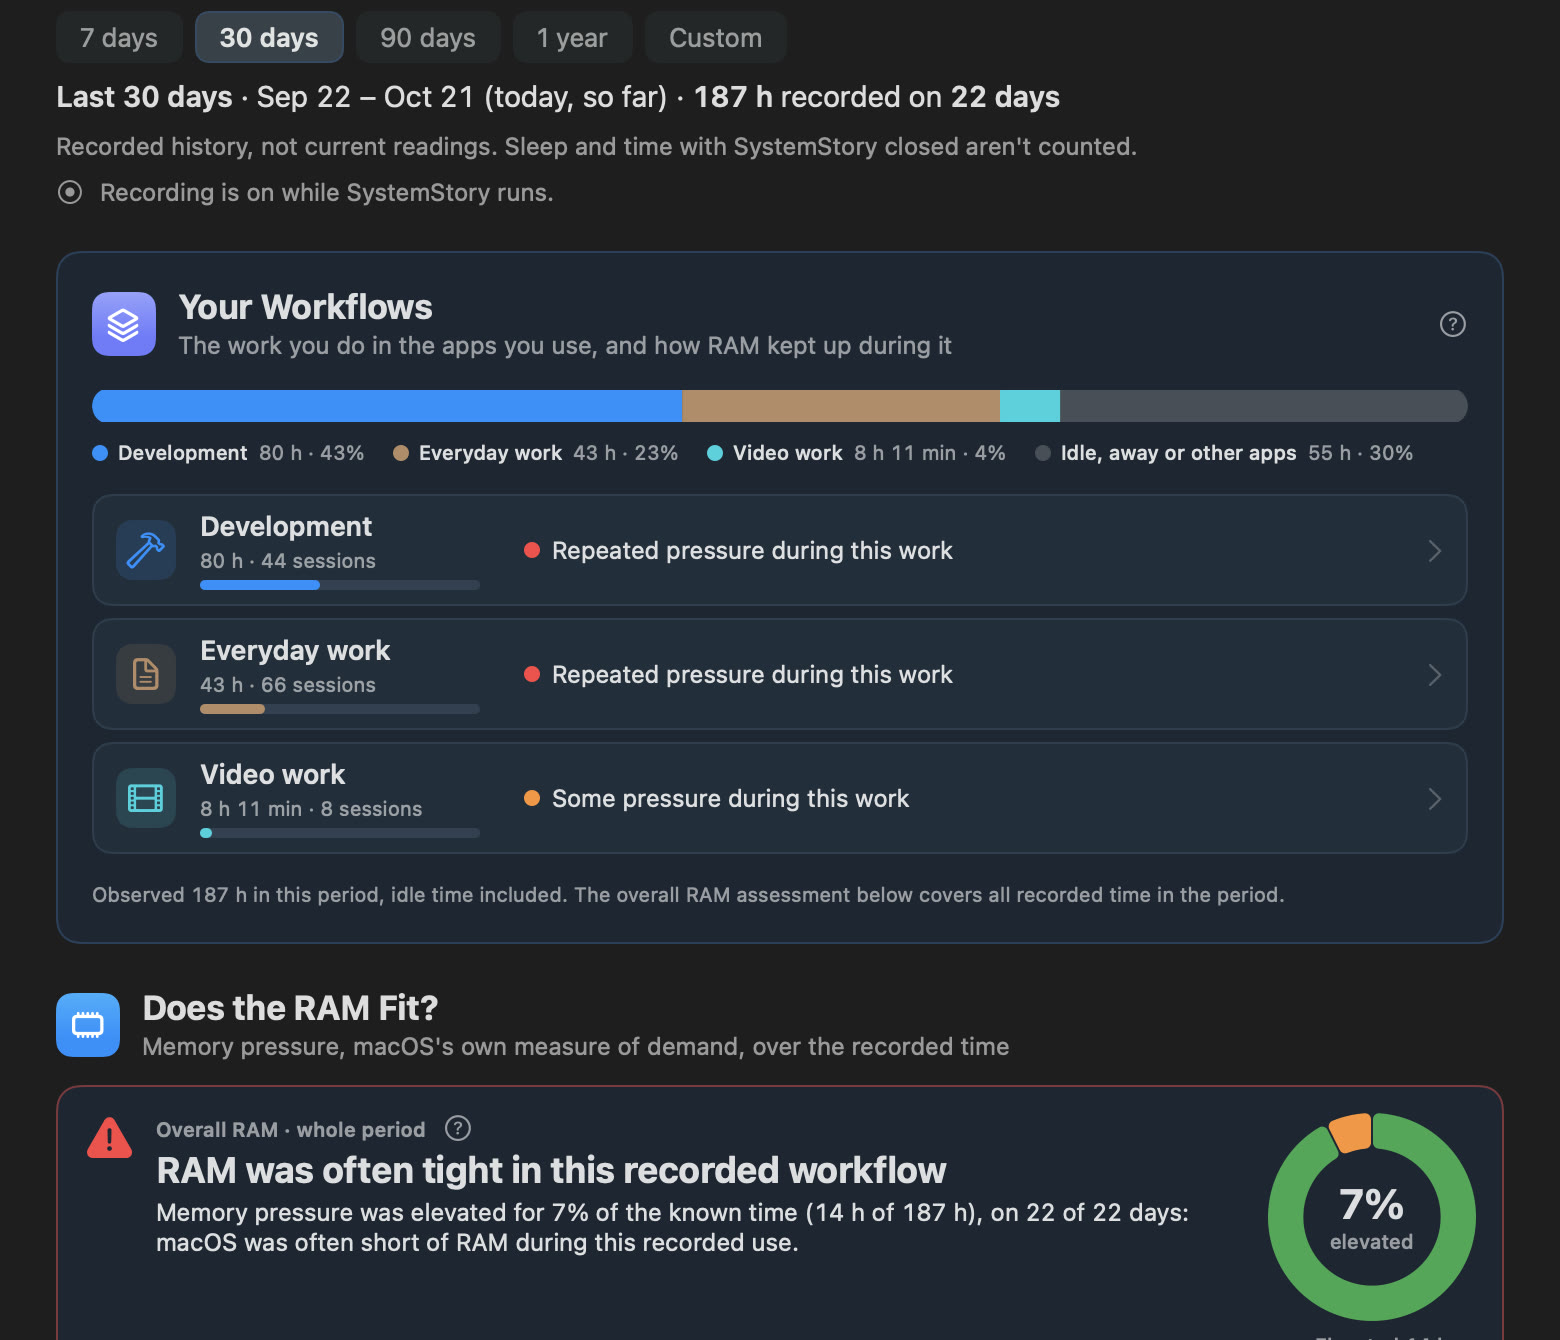
Helpers count with their app, 300 simulator processes become one row, and a Windows game in CrossOver appears as itself - separate from CrossOver.
-
RallySim.x64.exeBackground program9 processes8.4 GB
-
Xcode5 processes4.9 GB
-
Simulator system processesSimulator300 processes3.3 GB
-
Safari11 processes2.8 GB
-
CrossOver2 processes0.5 GB
Footprints are ranked; they include shared and compressed memory, so they don’t add up to RAM used.
Usage Advisor
The kinds of work you do, and how RAM kept up.
SystemStory notices the work you do - development, everyday apps, video, games - and shows how much time each took. Open a workflow to see its sessions and the whole Mac’s memory pressure during them.
When pressure repeats, check the unusual sessions first. More RAM only matters if that is your typical work.
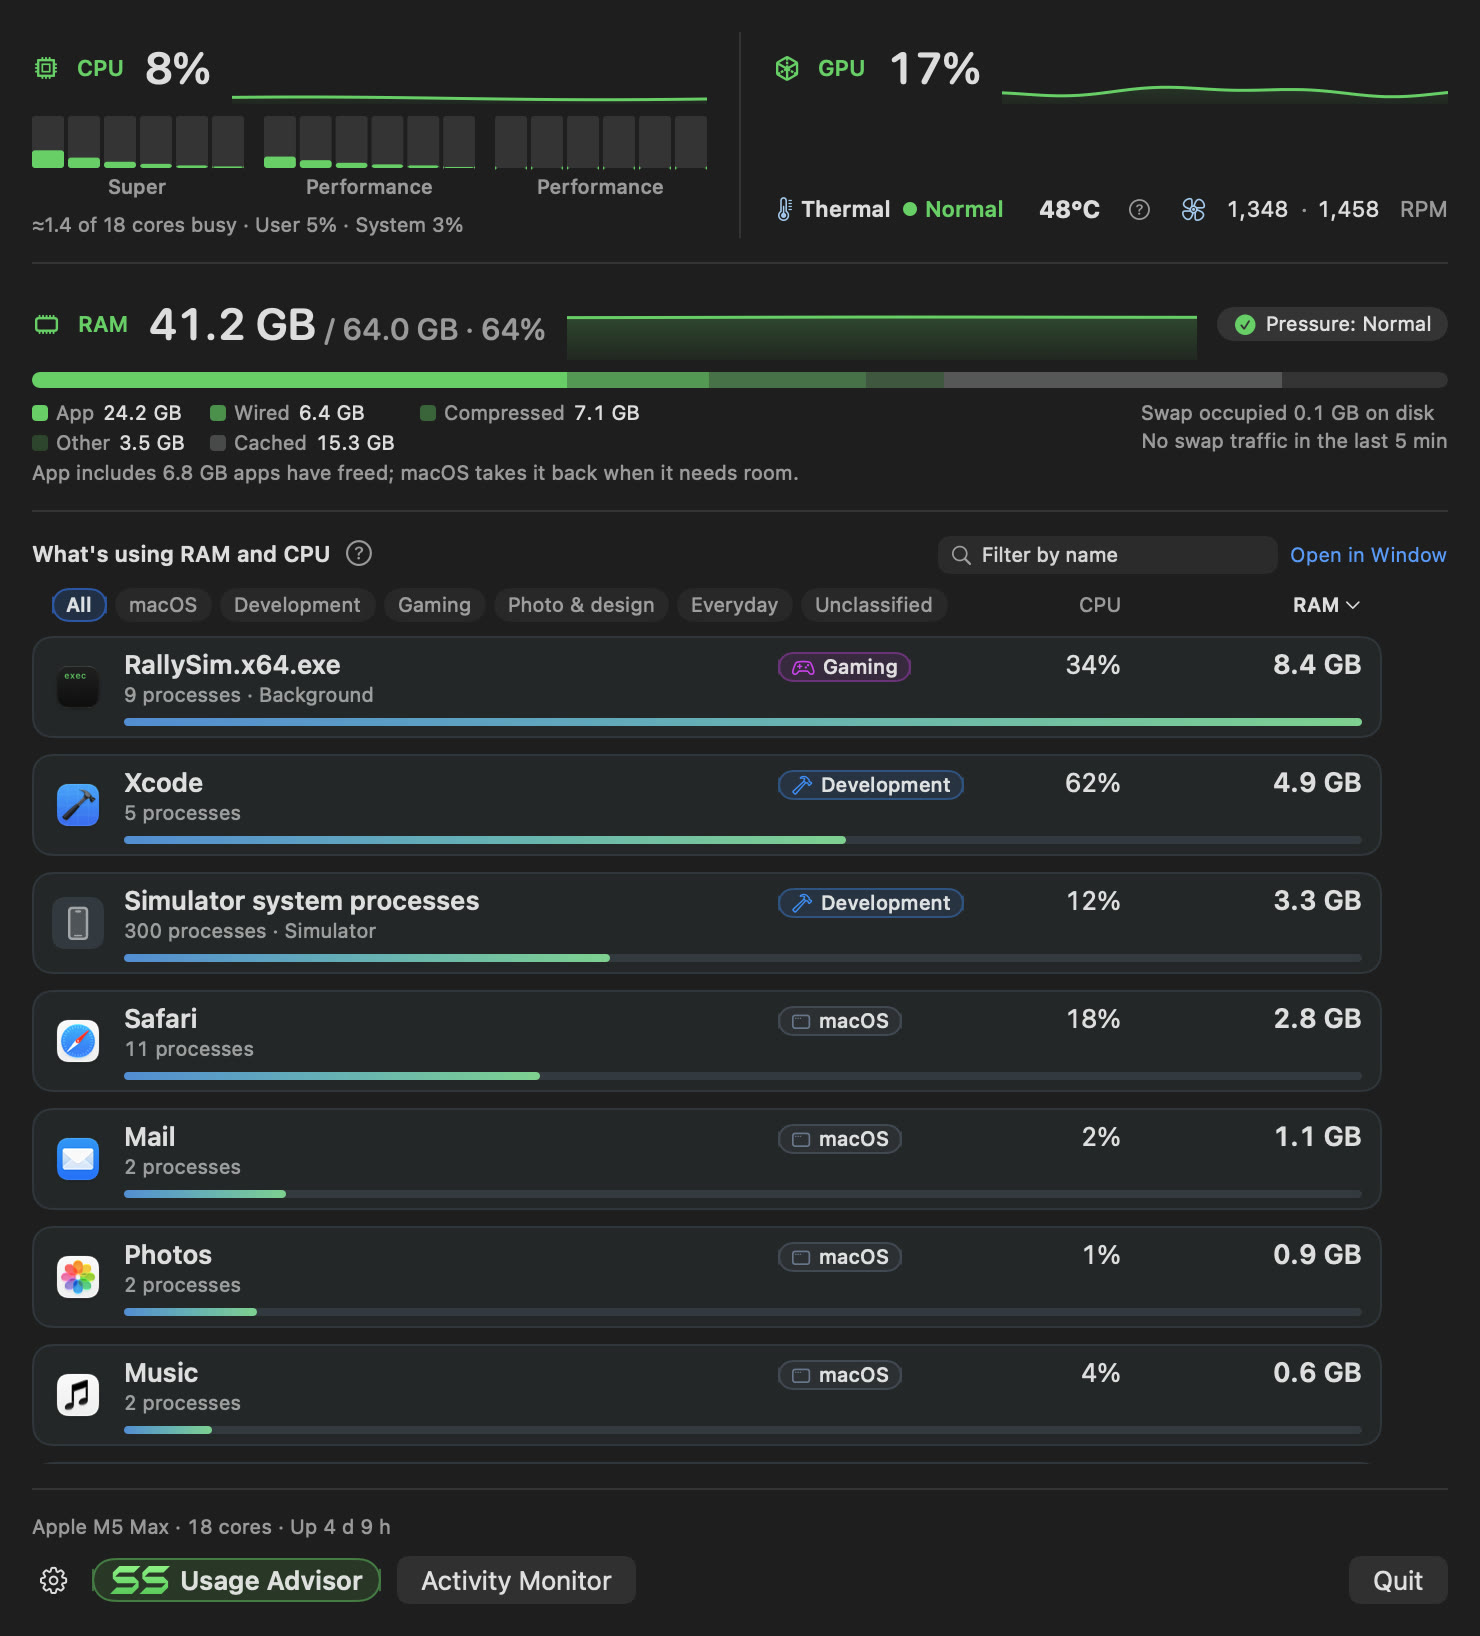
Last 30 days · Sep 22 – Oct 21 · 187 h recorded on 22 days
Your workflows
- Development 80 h · 43%
- Everyday work 43 h · 23%
- Video work 8 h 11 min · 4%
- Idle, away or other apps 55 h · 30%
Elevated in 14 of 44 sessions (7% of 80 h known). Review those sessions’ programs for unusual behaviour first; more RAM only matters if this is necessary, typical work.
Recent sessions oldest to newest
Oct 21 at 10:47 AM · 1 h 45 min · memory pressure elevated for 15% of it. The whole Mac’s memory pressure during this session, not one app’s.
Elevated in 21 of 66 sessions (7% of 43 h known). Review those sessions’ programs for unusual behaviour first; more RAM only matters if this is necessary, typical work.
Recent sessions oldest to newest
Oct 21 at 1:34 PM · 42 min · memory pressure elevated for 15% of it. The whole Mac’s memory pressure during this session, not one app’s.
Elevated for 4% of 8 h 11 min known, from 8 sessions, without a clear pattern yet.
Recent sessions oldest to newest
Oct 19 at 11:02 AM · 1 h 1 min · memory pressure elevated for 4% of it. The whole Mac’s memory pressure during this session, not one app’s.
Does the RAM fit? Often tight in this recorded workflow. Memory pressure was elevated for 7% of the known time (14 h of 187 h), on 22 of 22 days. Review Sep 24 for unusual app or process behaviour first; more RAM is worth considering only if this is necessary, typical work.
Workflows come from the app in front while you’re active, or from sustained heavy work. Pressure is the whole Mac’s during that time, never blamed on one app.
- CPU per app. Live in the panel, and CPU time per app in history when app recording is on.
- Thermal state. The state macOS itself reports, live and over time.
- GPU load. With a short trend beside CPU in the panel.
Temperature and cooling, at a glance.
See the sensor temperature beside macOS’s thermal state, and each fan’s current speed. °C or °F, your choice.
On supported Macs in the direct build. Fanless Macs, such as MacBook Air, simply show no fan speeds.
How the RAM numbers work
RAM used is App + Wired + Compressed + Other, as Activity Monitor counts Memory Used. Cached files aren’t counted; macOS reclaims them when needed.
Footprints are measured per program and ranked. They include compressed memory and can count shared memory more than once, so they don’t add up to RAM used.
Coverage. Some macOS processes can’t be read. A row measured only in part says “partial”, and the app’s ? help shows exactly how much was covered.
Shows, never “cleans”. SystemStory doesn’t quit, flush or optimise anything. You decide.
History
Is your Mac busier than it used to be?
Up to a year, kept on your Mac. Compare a period with the one before - when prior recorded data is available.
Period7 days30 days90 days1 yearCustom
Last 30 days · Sep 22 – Oct 21 · 187 h recorded on 22 days
- RAM pressure normal
- 93%7% elevated · of known time
- CPU load, average
- 17%while recorded
- GPU load, average
- 20%while recorded
- Thermal serious or critical
- 0%fair for 1 h
| Measure | Last 30 days | Previous 30 days |
|---|---|---|
| Recorded | 187 h | 179 h |
| Days with data | 22 | 21 |
| RAM pressure elevated | 7% | 8% |
| Compressed RAM, average | 17.5 GB | 17.5 GB |
| Swap reads and writes | 5 MB/h | 5 MB/h |
| CPU load, average | 17% | 17% |
| GPU load, average | 20% | 20% |
| Thermal serious or critical | 0% | 0% |
How comparisons stay fair
Each share uses its own period’s known time, so different coverage stays comparable. Sleep and time with SystemStory closed are gaps, never counted as idle.
CPU and GPU averages are the share of capacity in use while recorded. They aren’t CPU-time totals; the app lists show CPU time per app.
Without earlier recorded data there’s simply no comparison - nothing is estimated.
- 7 days, 30 days, 90 days, a year or your own dates. Choosing a period never deletes anything.
- Optional app history. Ranks apps by RAM footprint and CPU time. Off until you turn it on.
Example reports. Different workflows.
Does your workload need more RAM?
See whether your current Mac still fits your work, using recorded memory pressure during the work you actually do.
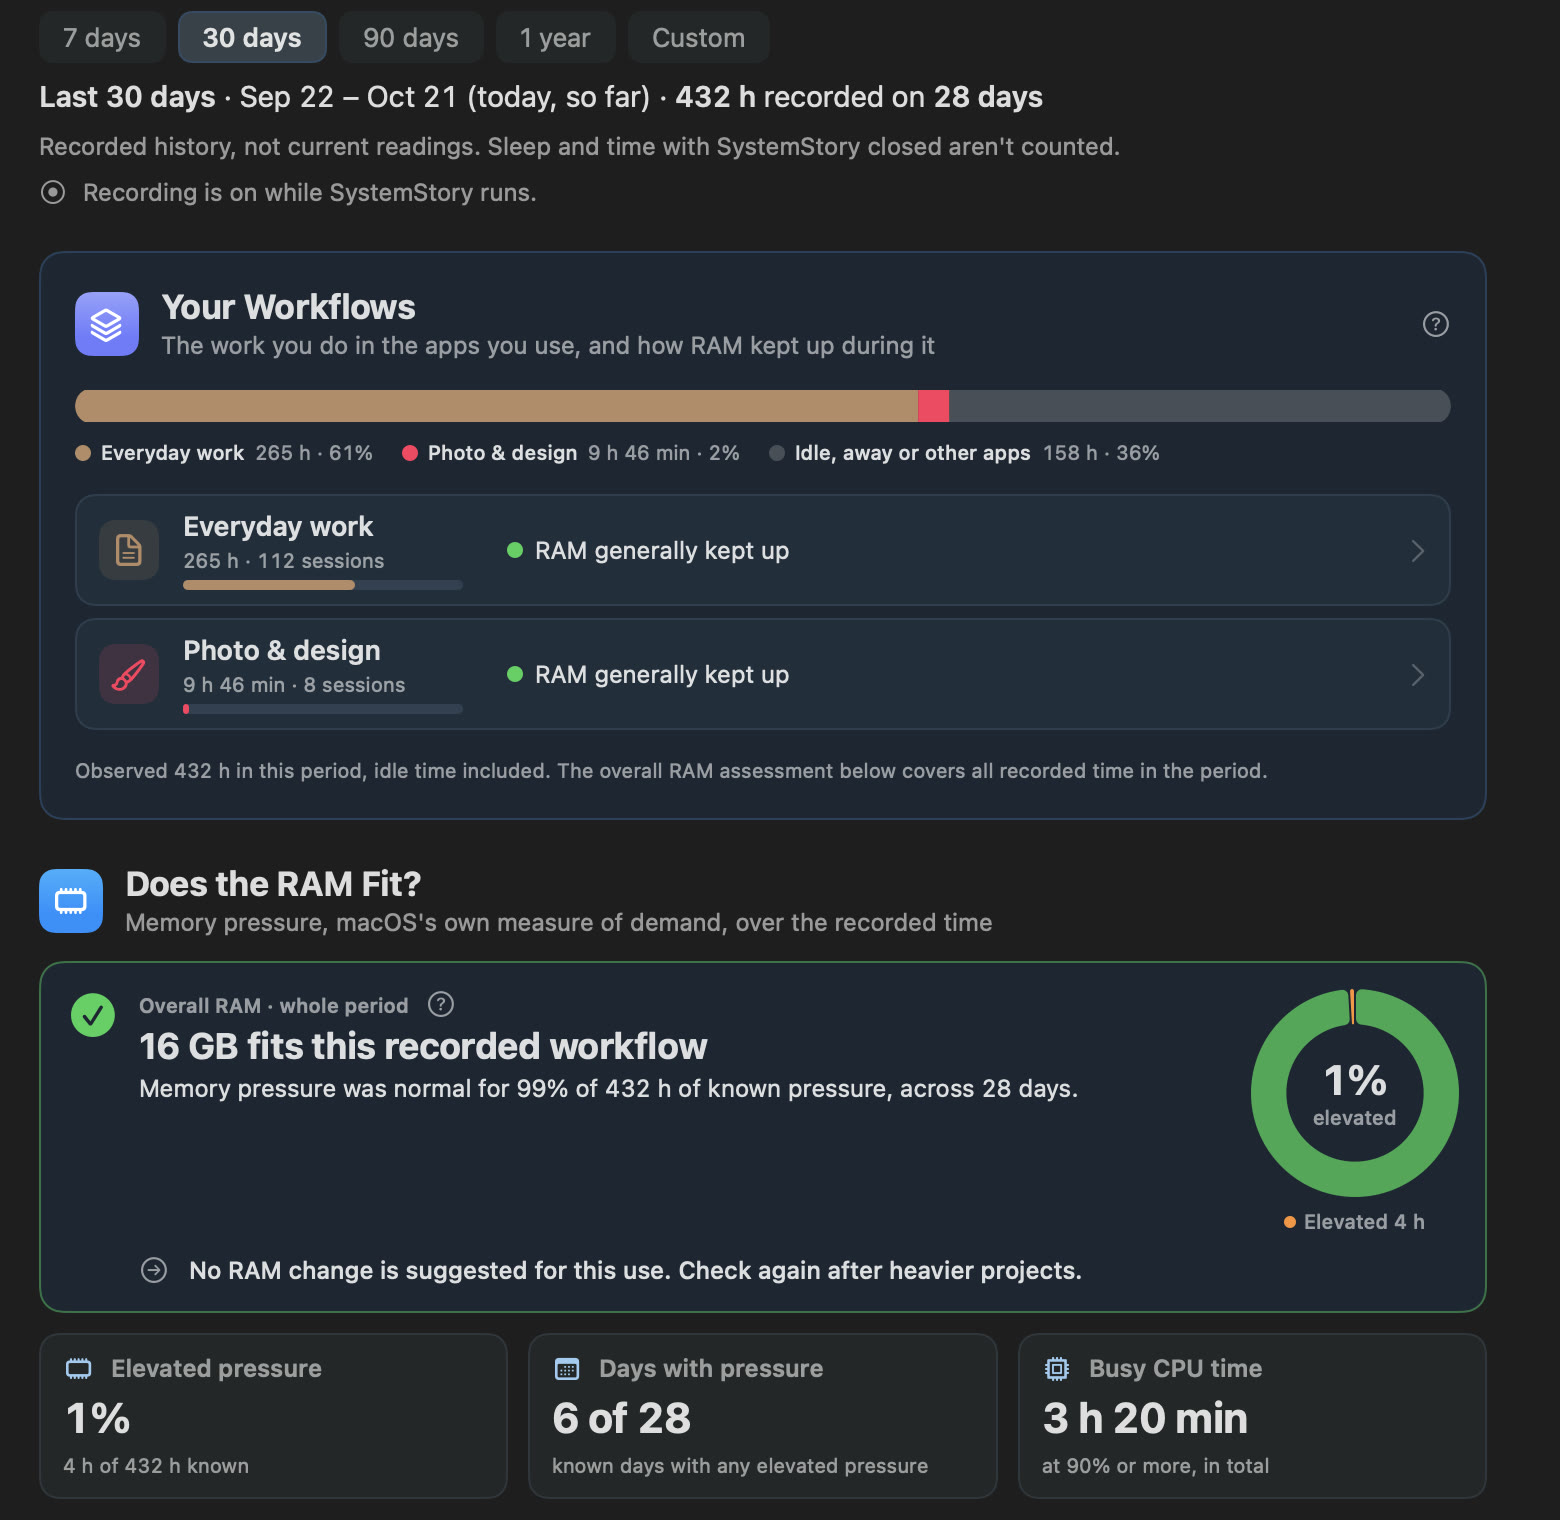
No RAM change suggested for this use. Memory pressure stayed normal for 99% of 432 recorded hours of everyday and photo work. Heavier projects would need a new look.
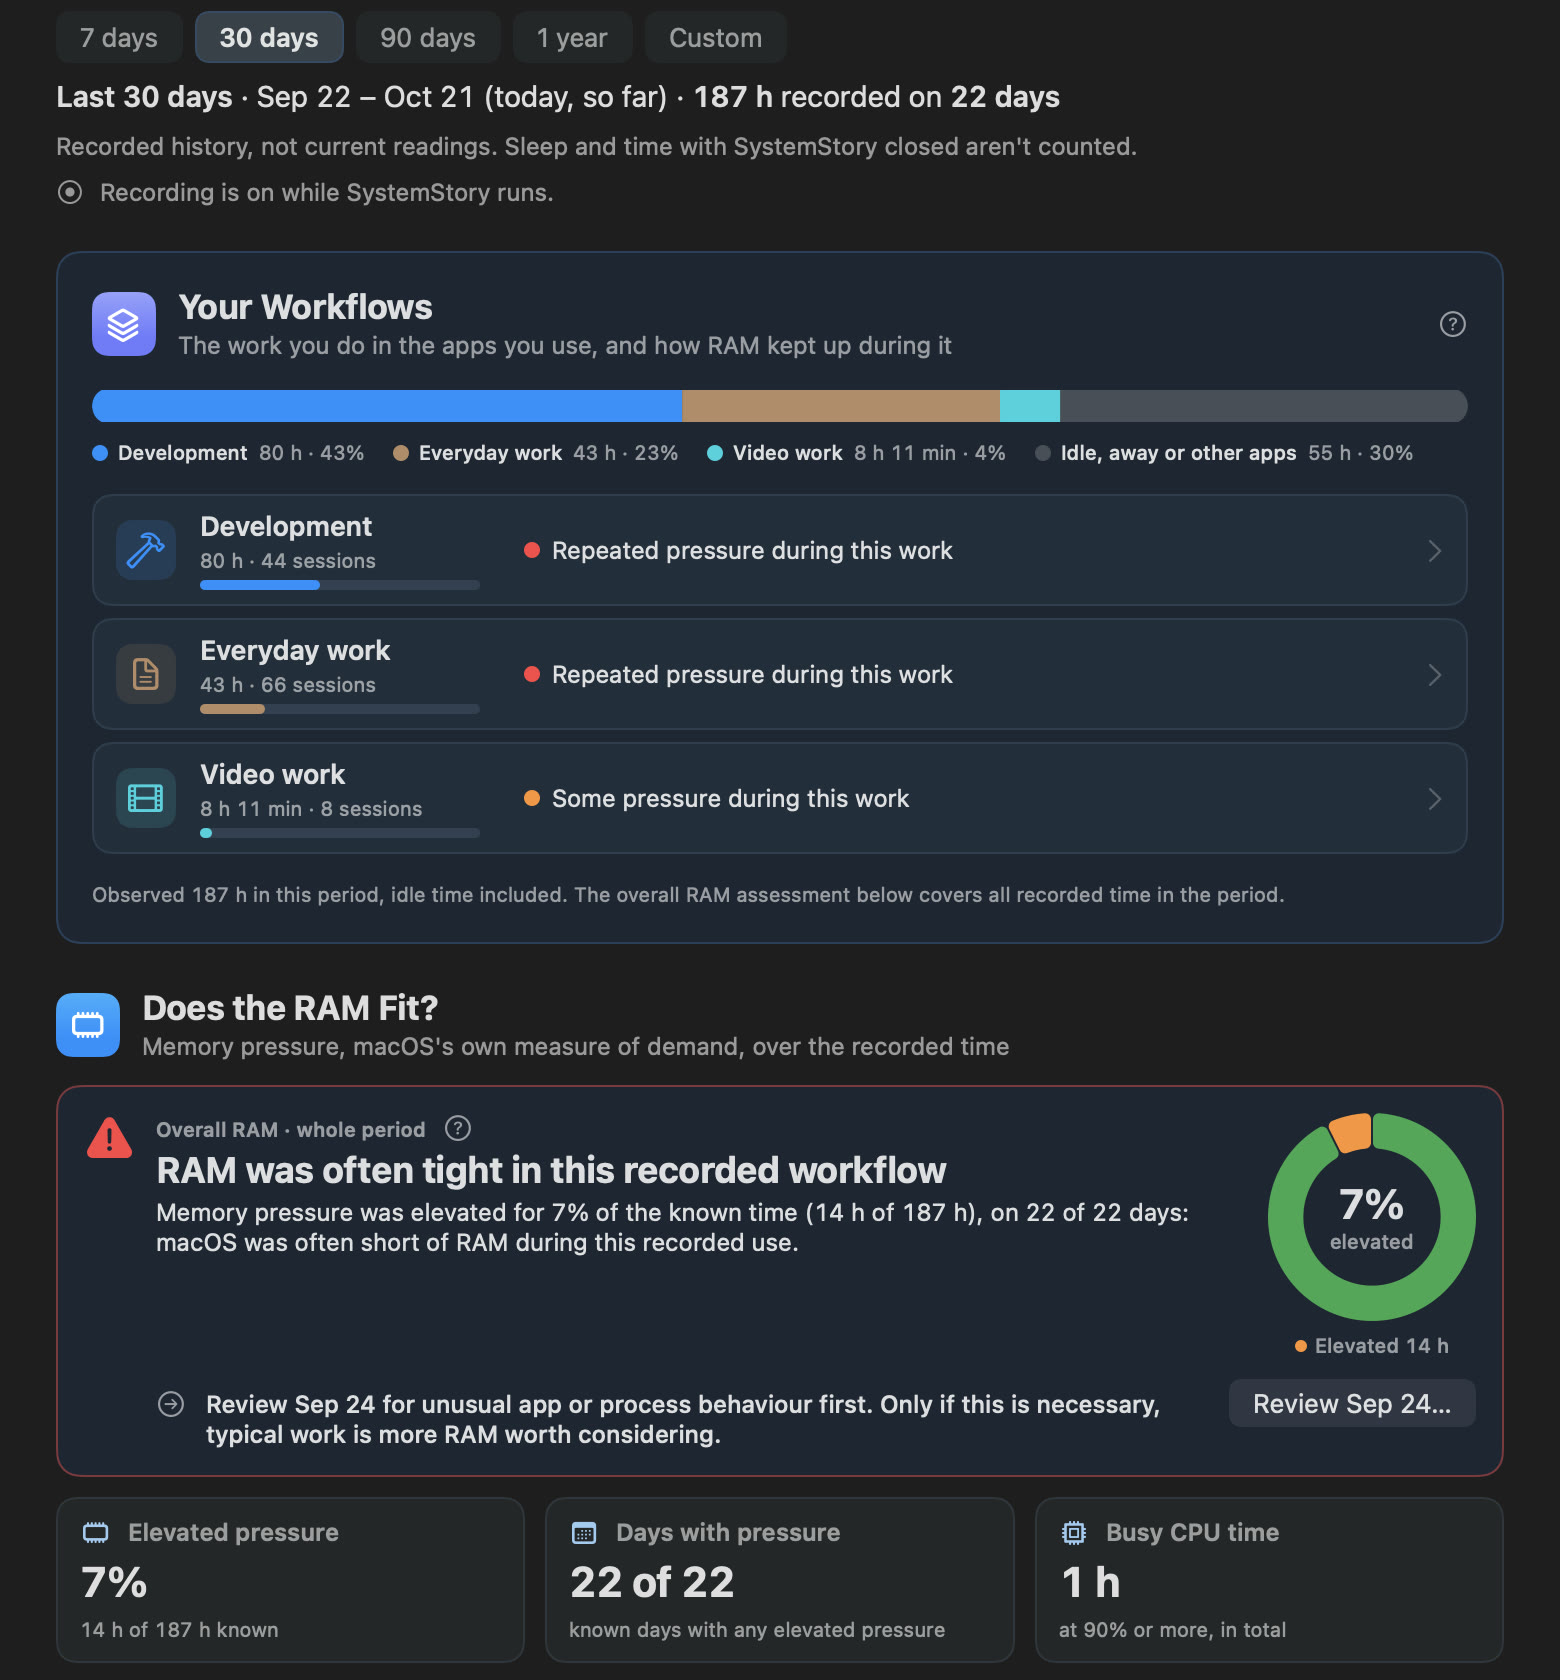
Even 64 GB was often tight here. Pressure was elevated for 14 of 187 recorded hours, during development and everyday work alike. Check the unusual sessions first; more RAM is worth it only if this is typical work.
Everyday decisions
Less watching. Better decisions.
SystemStory stays out of the way until something is worth your attention - and keeps the record when a bigger decision comes up.
-
A quick glance, then back to work.
CPU, GPU and RAM sit quietly in the menu bar. Open the panel only when you want the detail behind them.
-
Catch sustained work on battery.
Turn on the optional alert, and SystemStory sends a notification when the CPU stays busy for several minutes on battery - so background work doesn’t go unnoticed.
A sustained CPU-load alert, not a battery-life forecast.
-
Upgrade for your workload.
See memory pressure during each kind of work, check unusual sessions and apps, then decide whether this Mac still fits your work.
Ask for advice without sharing your secrets. Copy a text report or share an image - app names stay out unless you include them, and there’s never a machine name, serial number or user name.
Pricing
Buy once. Every feature in every pack.
Try the full app for 7 days first. No subscription.
Prices in US dollars, plus VAT where it applies. Checkout is handled by Stripe.
Which Macs does it work on?
Macs with Apple silicon (M-series) running macOS 26 or later. Not Intel Macs.
Can I buy it now?
Yes. Download the free 7-day trial, or choose a pack on the pricing page: $4.99, $9.99 or $24.99, once, plus VAT where it applies. Your licence key is shown after payment and emailed to you.
Does it free up RAM?
No, deliberately. “RAM cleaners” mostly push useful cache out. SystemStory shows what’s using RAM; you decide what to close.
Does my data leave my Mac?
Your usage history stays on your Mac. The app has no account and no analytics. SystemStory goes online only for its licence and, if you allow them, update checks. For the licence it connects to activate it, renew it about once a day, or release a Mac. For that it sends the licence key or activation and a random installation ID - never your history. The trial needs no network. Privacy
Is there a referral or partner program?
It’s planned with direct sales. Rewards and terms aren’t set yet and will be confirmed before anyone signs up. Partners & press
Recommend SystemStory
Know someone whose Mac feels slow?
Share the link today. A referral program is planned with direct sales; its terms will be confirmed before sign-up.